
Bar Graph Of The Day
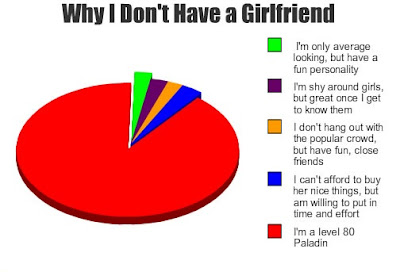
Knowing that The Eye is a connoisseur of all things ‘graph’ I thought I would share this particular bar graph, that I happened across on my travels around the interwebz thingy. It’s not the original. I’ve tarted it up a bit because when I first saw it, it looked like someone had put it together in a tearing hurry … using a knife and fork …. blindfolded.
Anyhow, it tells us the possibilty of how often a computer type geek is likely to ‘hit’ on a girl in any particular given situation. No. Being neither a geek, a girl or an online computer game player it doesn’t really float my boat either. However, it just goes to show that there is an info graphic, bar graph or pie chart available for just about everything you can think of.

Hmmm, so apart from the fact that The Eye likes ‘charty’ things and I found it mildly amusing, in a sad kind of way, I don’t really know what the point of posting this is.
Oh well, maybe you’ll all sleep better tonight for just knowing.
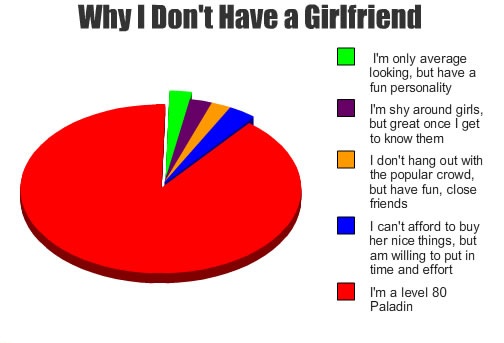
UPDATE: TheEye is very grateful to Max for posting that, and would like to remind everyone how things really work in the world of geekdom:
Recent Comments